Showing posts with label fear of crime. Show all posts

Wednesday, March 11, 2026

The problem isn't the underpass

Poor underpass design, placement and maintenance are only part of the problem

by Mateja Mihinjac

Few examples of pedestrian public infrastructure have as much potential to go wrong as pedestrian underpasses. Nearly every city I’ve visited has at least one that has become problematic.

I have blogged on this in the past such as underpass graffiti and homelessness. But the problem is bigger than that. The problem centres around participatory design and ongoing stewardship.

Underpasses can separate pedestrians from traffic, but many urban designers treat them as a last resort. New Zealand Transport Agency guidance notes that at-grade crossings are usually preferred because they keep pedestrians visible and the street active, which supports perceived safety.


Underpass in Ljubljana, Slovenia - a much too-common example of neglect and fear in underpasses around the world 


The tradeoff is predictable. Underpasses often feel isolated, attract neglect, and can be hard to use for older adults, people with disabilities, and parents with strollers.

Research on fear of crime consistently shows that enclosed pedestrian tunnels and underpasses can generate strong perceptions of danger when lighting, visibility, and maintenance are poor.

Because of these concerns, street design guidelines increasingly favour at-grade crossings such as raised crosswalks, traffic calming measures, and pedestrian-priority streets that keep pedestrians visible and integrated into everyday street activity.


A SENSE OF DISGUST & INFRASTRUCTURE LIABILITY

A few days ago I came across an article about one of the underpasses in Ljubljana that has been problematic for years. Recently, the city has decided to close it completely. The underpass runs beneath a busy arterial road and connects a large shopping mall with nearby residential buildings and local services. 

This pedestrian underpass in Ljubljana was built to protect people from traffic. Today, it is closed because it became unsafe to use. 

I remember using the underpass several times a few years ago. Each time I dreaded it. The tunnel was dark and smelled strongly of urine. One entrance was covered with graffiti tags. A section of the corridor was often flooded with stale smelly water. People loitered there for long periods. 

On one occasion a couple of years ago, a man in the underpass approached me asking if I offer “special services,” after saying he only wanted to ask me a question during my walk to the shopping mall. More than fear, the experience produced a sense of disgust — the feeling that this space had been abandoned by those responsible for managing it.


A closed underpass - why were problems allowed to grow in the first place?  


After years of decay, the city eventually closed the underpass completely. What makes the situation even more striking is that the tunnel sits next to one of the most prestigious residential developments in Ljubljana, currently the tallest building in the city.

The article reports the decision to close it came from “professional assessment of the current state of the infrastructure, safety risks and the sensibility of its continued use”. It also reports on people’s complaints concerning the homeless, faeces, urine, syringes, vandalism and rubbish that kept accumulating in the underpass. 

No decision has yet been made whether this closed underpass will eventually reopen. It raises questions: What engineers are responsible for this? Who are the decision-makers? What are they saying? How did they neglect this for so long? One can only imagine what conversations are going on behind closed doors. And that leads to the true problem- the design process! 


IT ISN’T THE UNDERPASS…IT’S THE PROCESS

When cities close infrastructure because it feels unsafe, something usually went wrong long before the first complaint. This is not simply about lighting failures or graffiti. It is about a system that failed to monitor, maintain, and adapt.

Some cities are beginning to recognise that infrastructure like pedestrian tunnels cannot be evaluated by engineers alone.


Steven Eisenhower bicycle Tunnel, Nijmegen, the Netherlands
- photo Steven Vance, CC BY 2.0 via Wikimedia Commons


A useful example comes from Toronto, where the Glen Road Pedestrian Bridge and Tunnel Environmental Assessment incorporated extensive public consultation. Community feedback helped identify safety concerns and guided improvements to ensure the infrastructure actually worked for those expected to use it.


PRACTICAL LESSONS LEARNED

From a CPTED and SafeGrowth perspective, the Ljubljana underpass displayed several familiar warning signs. Poor natural surveillance created hidden spaces, weak territorial reinforcement meant the area felt like it belonged to no one, and low activity levels reduced informal guardianship. Over time, maintenance declined and limited community engagement allowed problems to persist largely unnoticed.

None of these issues appeared overnight. They develop gradually as stewardship declines.

Modern CPTED guidance recognises that design alone cannot maintain safe places. Ongoing stewardship and community involvement are essential. Technical guidance such as the Queensland Transport and Main Roads Department’s underpass design guidelines provide useful direction.


Australian urban design guidelines developed by social planner Wendy Sarkissian


SafeGrowth engages residents and local users in diagnosing problems and shaping solutions. Community knowledge often identifies risks long before they appear in official reports. Without that feedback loop, infrastructure can slowly decay into places people avoid.

SafeGrowth emphasises participatory safety planning, where residents, practitioners, and local agencies discuss design and management issues together. In these processes, the social planning principles championed by social planner Wendy Sarkissian remain especially valuable. 

Pedestrian underpasses are not inherently unsafe but closing them may sometimes be necessary. The real question is why the problem was allowed to grow in the first place.

Safe cities do not maintain themselves. They depend on stewardship and the people who care enough to protect them.


Tuesday, March 14, 2023

Conflating social disorder with violent crime

Many factors impact fear of crime - such as night lighting  

Tarah Hodgkinson

Just because an area may appear dangerous, doesn’t mean it is dangerous. Criminological research indicates that fear of crime has all kinds of impacts on community safety. It often correlates with people retreating into their homes and out of the public sphere, creating more opportunities for crime and generating even more fear. 

This field of research examines the kinds of indicators of disorder that lead people to be afraid, including both physical and social factors. These can range from groups of teenagers hanging around, seemingly without purpose, broken windows and graffiti, to sex workers openly soliciting and visible drug use. 

However, we don’t often discuss the way in which these physical and social indicators of disorder can lead to misperceptions about the type of crime that may be occurring. 


Digitized Fulcrum safety audits - one of our SafeGrowth tools
to compare reported crime with spatial patterns of fear

I was recently putting together a short fact sheet about crime and social disorder for a mid-sized community in Ontario. Like many cities across the country, this community was dealing with a significant rise in visible homelessness in their downtown core. And similar to many cities, there was concern that the increase in homelessness would also mean an increase in crime and violence. 

To analyze the police data, I again used a data analysis tool called the location quotient, a metric that measures crime specialization to inform policy and prevention. This differs from crime rates or crime severity measurements which are easily influenced by population size. 


CRIME SPECIALIZATION 

In this case, the findings indicated that while social disorder specialized in the downtown area, no other crime type, including violence, was overrepresented downtown. This does not mean that violence is absent in the downtown area. What it does mean is that, compared to the rest of the city, the downtown does not account for most violence. 

While social and physical indicators of disorder, including homelessness, may create perceptions that an area has a crime and violence problem, that often isn’t the case. Rather, what is happening, is that the police are overwhelmingly responding to social disorder and visible indicators of poverty and disadvantage. 

This isn’t surprising for criminologists, but it is an important finding for communities and policy makers. It doesn’t mean that these areas should be policed more heavily, but instead that we need to address the roots of poverty and homelessness in these areas. That is how we create safe and inclusive places for all. 


Tuesday, April 19, 2022

Bus stops and crime - 30 years later

Bus stop location in Scarborough not far from where
Paul Bernardo waited at night to follow and sexually assault women


by Gregory Saville

Between May 1987 and June 1990, Toronto police investigated the case of the Scarborough Rapist - Paul Bernardo. Scarborough is a sprawling suburb of Toronto and at the time the fear of a serial rapist spread across the entire Toronto metro like wildfire, especially along public transit lines. This notorious and horrific case is well-known in Canada and eventually led to the arrest and conviction of Paul Bernardo, the rapist (by that time, tragically, a serial murderer). 

I first learned of this case as a police patrol officer 25 miles west of Scarborough, but we knew very little about the facts at that point. Coincidentally, I was also in urban planning grad school at that time and one of my professors asked me to join a new group conducting field visits and safety reviews on the Toronto transit bus and subway system resulting from the Scarborough rapes. They created their audit form from research on CPTED and they were calling it a safety audit. 

That is how the safety audit was born – out of tragedy and necessity. 

Up to that point, fear of crime patterns was surmised from generic surveys, but specific geographical details were sketchy. We knew from interviews what residents said about fear, but little about the specific places that triggered those fears. The Safety Audit changed all that.


Today, many Scarborough bus stops are not much better than in the late 1980s


SAFETY AUDITS IN COLORADO

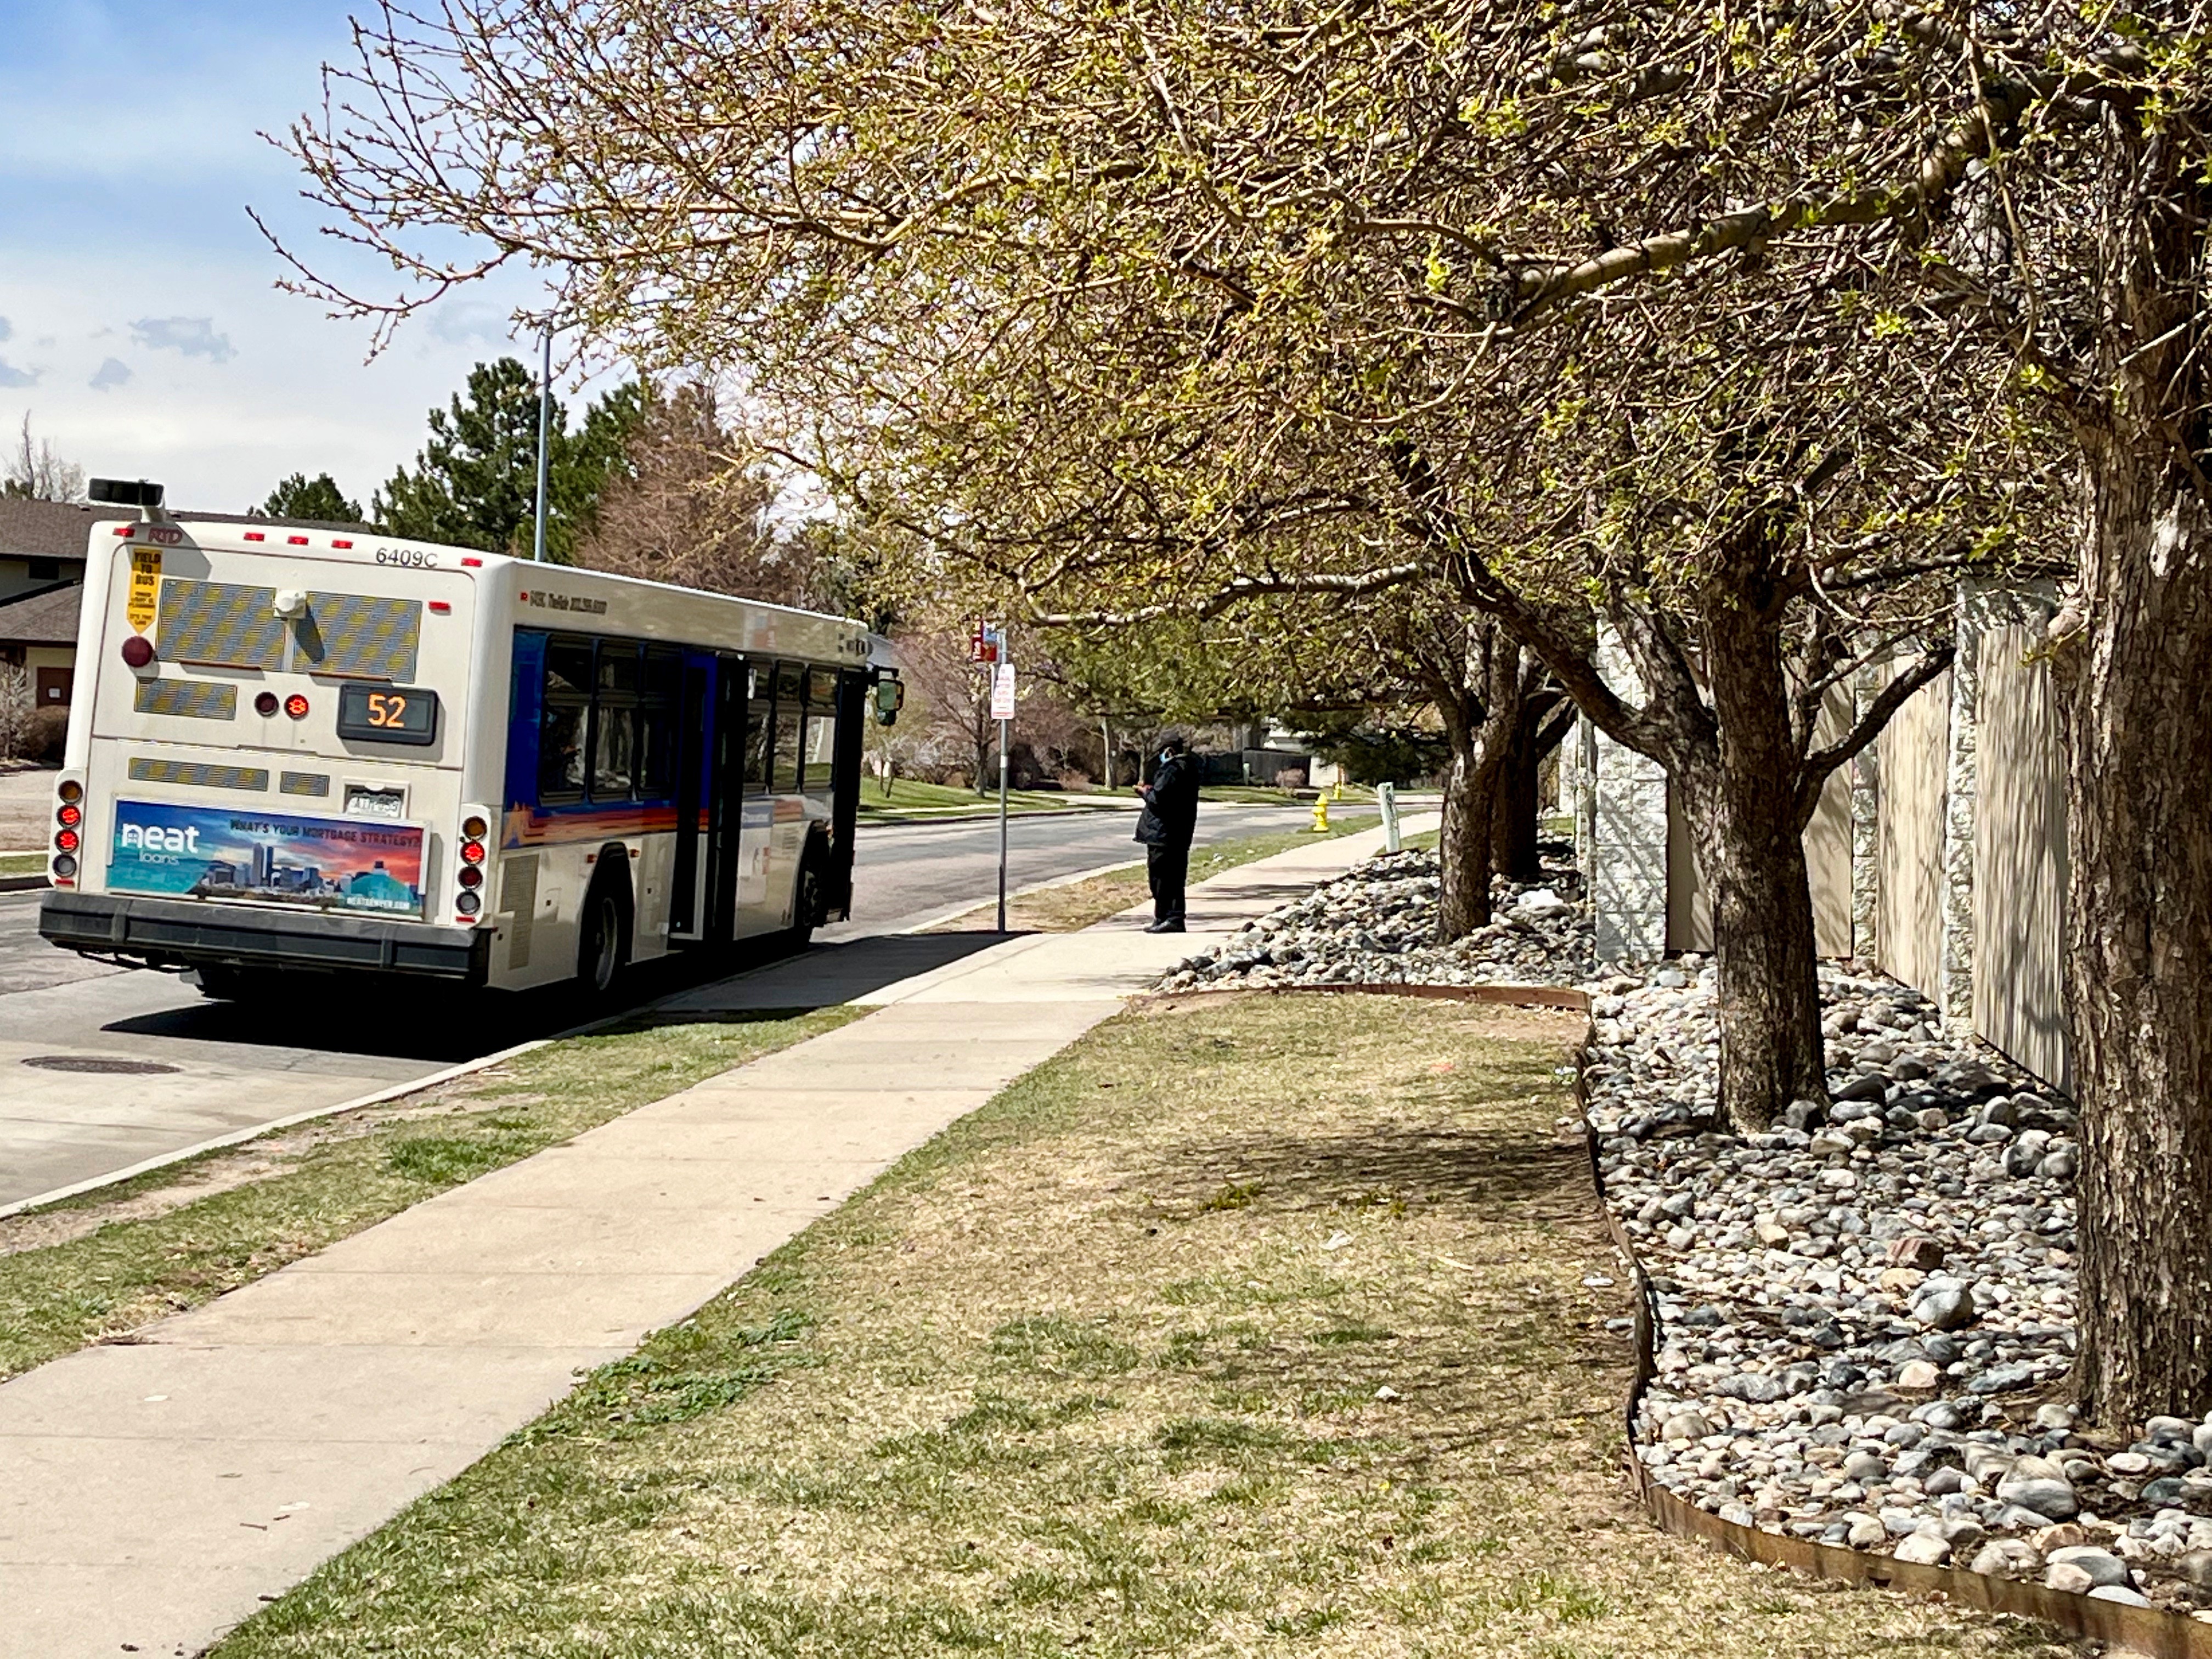
A few days ago I helped a local transit committee conduct their first Safety Audit on a bus stop near my home – the first audit of its kind in Colorado. 

What we found was fascinating. We discovered an isolated and remote bus stop location with few nearby opportunities for natural surveillance. We learned that bus drivers reported disorderly incidents on this route and that this stop was the end of the line and was nowhere near restroom facilities. We also uncovered a nearby shopping mall with numerous crime incidents, including a recently burglarized restaurant when we discovered a jimmied front door (we called the police). 

Thus, we were able to report a crime before the owner learned about it. I spoke to him when he arrived and, naturally, the poor fellow wasn’t happy! He was the latest victim of crime in this shopping mall next to our bus stop. 

As this transport committee learns how to use the Safety Audit process, they will eventually have the capacity to conduct other safety reviews across other parts of the transportation system. 


Metro Denver bus stop location a few days ago during our Safety Audit
- many similarities to other cities


SIMILAR AROUND THE WORLD

Safety audits are not new to this blog. Seven years ago, Tarah blogged on how to teach high school students the art of the Safety Audit in Every time they want to count you out – use your voice.

Four years ago I blogged on safety audits in A Tool for the Archeology of Fear. I described the mistake CPTED practitioners make when they confuse safety audits with CPTED surveys or visual checklist inspections. Some conflate Safety Audits with Jane’s Walks or Night-Out-Against-Crime. They too are wrong.

Then, two years ago, Mateja blogged on how she digitized our Safety Audit process for measuring fear in downtown Saskatoon.

What struck me this week is not how much the committee members enjoyed the Safety Audit process. That is a comment SafeGrowth advocates hear commonly during our training. Rather, the most striking thing was how similar design and location problems arise over and over at bus stops here and elsewhere. 

We have taught audits from Melbourne Australia, Christchurch New Zealand, San Diego California, and Calgary Alberta, to New York City, and Helsingborg Sweden. We usually uncover similar fear and crime opportunity risks in those cities just as they existed in Scarborough during the Paul Bernardo rapes 30 years ago. 

Will we never learn?


Tuesday, September 10, 2019

Tracking fear - measuring safety perceptions in Saskatoon


Saskatoon river trail at night
by Mateja Mihinjac

This summer, I led a team of eight city planners and set out to explore how the physical and social environment in downtown Saskatoon, Canada influences perceptions of personal safety. This was the first-ever micro-level, fear and safety project to use a specially tailored, digitized software app to map and analyse downtown safety in Canada. This is something geographers of crime and environmental psychologists have been studying for decades, but often without the precise measurements that we were about to uncover.

MEASURING PERCEPTIONS OF SAFETY

Perceptions of safety have been understudied in the field of criminology despite knowing that they may affect people’s use of the public realm more than actual crime. Moreover, from Crime Prevention Through Environmental Design - CPTED - we know that features on the streets, parks, and neighborhoods where we live may promote or reduce fear in that environment. Yet, we rarely measure this association.

Downtown Saskatoon street research locations
As a criminologist specializing in SafeGrowth and CPTED, the City of Saskatoon planning department hired me for the summer of 2019 to develop and pilot this downtown project.

The first step included the development of the field data collection survey, a modified version of the Neighbourhood Safety Audit that incorporates the principles of CPTED. The survey was then digitized in a GPS location-based data collection app called Fulcrum, that allowed us to capture and record data with our mobile devices for use in subsequent analysis.

DATA COLLECTION

We formed two research teams of four participants from the Saskatoon Planning & Development Division. Each participant had undergone CPTED/SafeGrowth training and was knowledgeable about urban design and safety. Teams collected night and daytime data within the downtown area over 13 days.

Daytime audits were combined with evening audits of the same locations
Because we were interested in perceptions and fear at a very micro-level, the study area was confined to the blocks and laneways within a four block area. We used our new app to collect information from 108 micro-spatial locations within a radius of 30 meters (100 feet) of each location, and then we also collected 596 additional intercept surveys with members of the public on the street at the time.

Detailed fieldwork like this is laborious and time consuming, but teams were diligent and we were able to gain invaluable insights, in some cases uncovering findings about fear that were previously unknown.

Fear and safety perception maps can be correlated with actual crime maps

PRELIMINARY FINDINGS

What did we learn?

  1. The social environment influenced perceptions much more than the physical environment. Respondents often couldn’t point to particular land use or design features impacting their perception of safety, but they were able to note people who increased their comfort levels, such as local employees, shoppers, and people running errands. Erratic and unpredictable behaviour on the street increased their anxieties. 
  2. Lack of activity in particular blocks due to underactive land uses impacted perceptions of safety, such as the 29 vacant storefronts in our study area. These vacant properties both lessened street activity and reduced “eyes on the street”.
  3. Interestingly, the respondents’ night-time perceptions did not appear as negative as we expected. Some parts were so inactive at night that we obtained very few interview responses. While CPTED surveys conducted by one team concluded these underactive areas were anxiety-provoking, when late-night social events and festivals activated the area, it positively influenced the perceptions in our surveys with the public. 
  4. Both the public participants and the CPTED team appeared reassured by the uniformed presence of community patrol officers in the Community Support Program. They particularly praised the Program for contributing to increased feelings of downtown safety. Many asked for expanding the program. 

One of the city planner audit teams during night field work
FINAL THOUGHTS

In our SafeGrowth training we often say: Once you learn CPTED you’ll never again look at the environment the same way. However, CPTED novices often forget that the environment encompasses both physical and social. This research provides evidence about the interplay between the physical and social environments on public perceptions. Clearly, physical and social CPTED strategies are equally important and must be part of all planning and prevention.

Saturday, March 31, 2018

A tool for the archaeology of fear

Safety Audits examine the nighttime city

by Greg Saville

They link neighbors in common cause against crime and they collect data to build fear maps in ways never before possible. And yet community Safety Audits are among the most misunderstood, and misused, tools in CPTED. 

In 2005 the United Nations Habitat program recommended the Safety Audit as a method to assess street crime and fear around the world. Safety Audits originated in the 1980s as a method to assess safety in bus and subway stops during the infamous Scarborough serial rapist crimes in suburban Toronto (ending with the arrest of serial murderer/rapist Paul Bernardo and his wife Karla Homolka).

I took part in those original Toronto Subway Safety Audits in 1988 and published a study about their power to unify residents as they record their perceptions of the neighborhood at night. Properly facilitated and staffed, Safety Audits are unique and empowering and they collect information not available on standard fear of crime surveys.

Parking lots are a frequent target of Safety Audits
MISTAKES

The first mistake is to think Safety Audits are the same as CPTED surveys or visual inspections for crime prevention. CPTED surveys work well on buildings and streets to assess crime opportunities in the nooks and crannies of everyday places. But CPTED experts cannot conduct a properly implemented Safety Audit; rather they can only facilitate residents. It is the native intelligence of residents that is recorded in a Safety Audit, not the assessment of an expert.

Some think Safety Audits are the same as a community walkabout, a Jane’s Walk, or Night-Out-Against-Crime. Those are not a systematic and coherent data collection activity like a Safety Audit.

SAFETY AUDITS ARE DIFFERENT

Authentic community Safety Audits:
  • Use a small group of locals to answer audit questions
  • Are generally conducted at night 
  • Are conducted within a 75 yard/meter radius of a location and then move to other locations to audit an entire area
  • Include women since they experience the night environment different than men.

Police, residents, CPTED facilitators, and others participate in Safety Audits

Unlike CPTED surveys, Safety Audits extend beyond the physical environment and hone in on social factors: How involved are local residents about their neighborhood? What is the history of this place? How might local residents help improve conditions? 

The latest versions of Safety Audits use computer tablets and GPS enabled software to more accurately record fear and map perceptions. A few years ago I recorded a VLOG with LISC Safety coordinator Mona Mangat on how to conduct a proper Safety Audit.  

Safety Audits are the ideal tool for crime archaeology – they help residents dig up fear and perception discoveries of their nighttime city that may be invisible in other crime assessment methods.